AI can scaffold your entire frontend in seconds. Cursor writes your components. Claude styles your layouts.
But here's what none of those tools do: open a browser tab and actually understand what's running inside it.
The gap between developers today isn't who can build, it's who can debug. When something breaks, most people do the same thing: paste the error back into the AI, refresh, guess, repeat. Meanwhile, the answer is just one F12 away.
DevTools has been quietly powerful for years. Most developers, especially those who learned to build with AI, have barely scratched the surface. Here are five features that will change how you work.
1. $0 and $_ Console Shortcuts
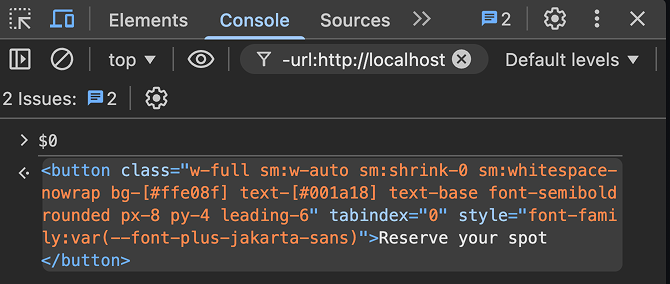
Have you ever clicked an element in the Elements panel, then switched to the console and typed out a full document.querySelector() just to grab it?
Try this instead: click the element, then type $0.
That's it. $0 always refers to the last element you inspected. You can call methods on it, read its properties, and manipulate it with no selector needed.
$_ is its sibling: it holds the result of your last console expression. If you just ran a calculation or fetched some data, $_ gives it back to you without retyping.
These two shortcuts alone will save you hundreds of small frustrations.
2. Network Request Blocking
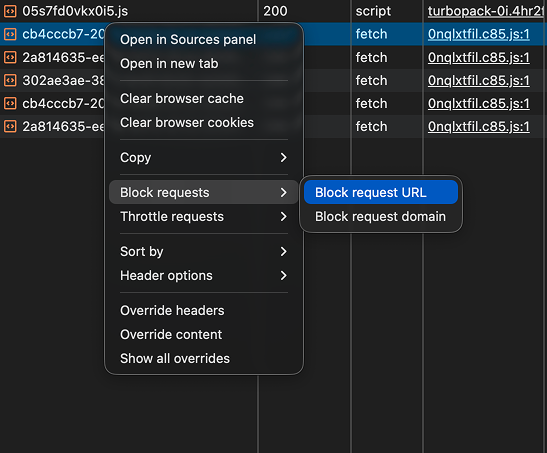
Have you ever wondered what your UI actually looks like when an API call fails, but had no easy way to simulate it?
In the Network panel, right-click any request → Block request URL. The request is blocked on every subsequent load without touching a single line of code.
This is invaluable for testing how your UI handles failures. Does your loading state work? Does your error boundary actually trigger? Does the page fall apart or fail gracefully?
AI-generated code often skips error states entirely. This feature makes it dead simple to verify yours actually work.
3. Local Overrides
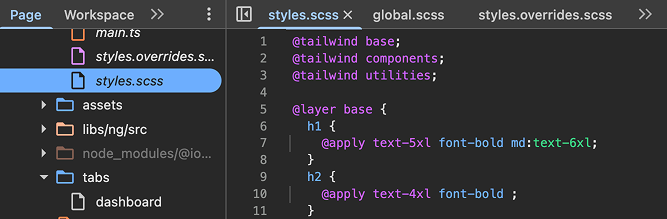
Have you ever spent ten minutes tweaking CSS in DevTools, got it looking exactly right, then lost everything the moment you refreshed?
Open Sources → Overrides and point it to a local folder. From that point on, any edits you make in DevTools get saved there. When you refresh, your changes persist because the browser is serving your overridden version of the file.
You can prototype layout changes, test font swaps, or experiment with spacing without touching your actual codebase. Only commit what you actually like.
This is one of the most underused features in all of DevTools. Once you use it, you'll wonder how you lived without it.
4. The Rendering Panel
Have you ever shipped a page then notice it feels janky?
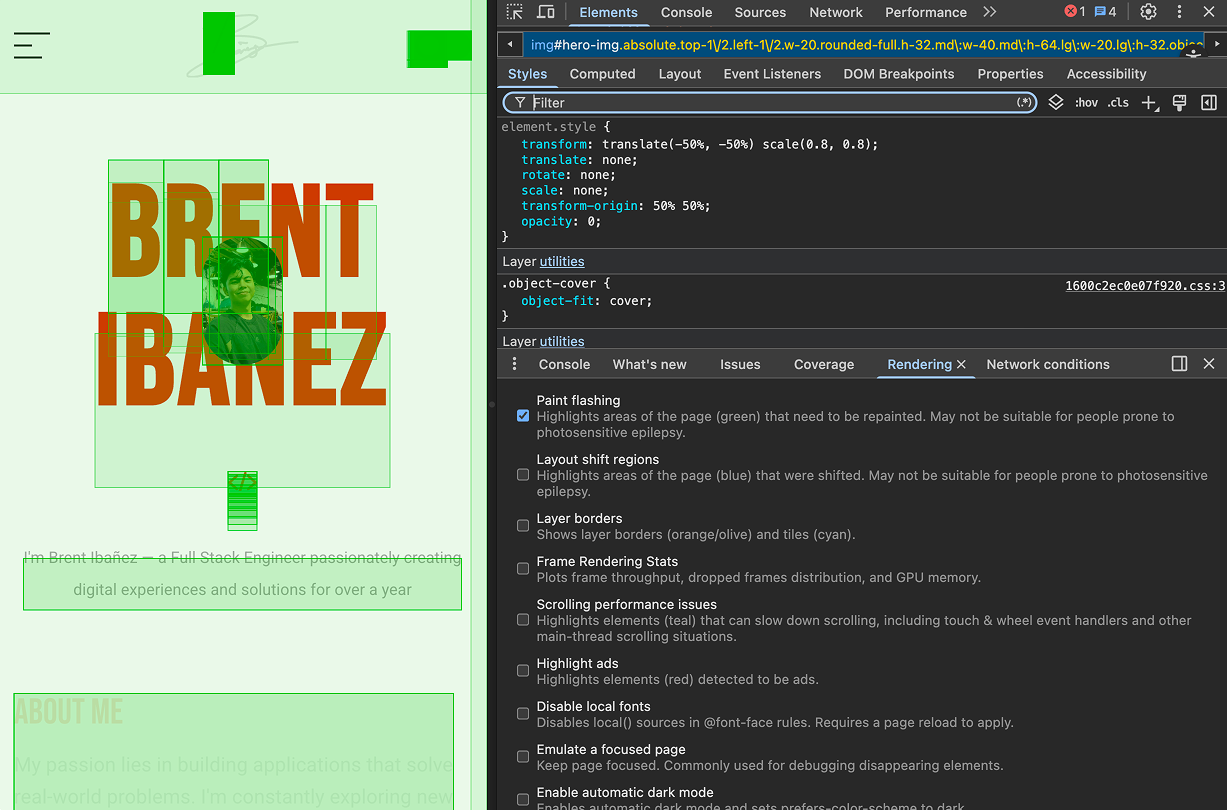
Try to open the Rendering panel (Cmd/Ctrl + Shift + P → type "Rendering") and turn on Paint Flashing.
Every time the browser repaints part of the screen, it flashes green. Scroll your page. Hover over elements. Animate something. You'll immediately see which parts of your UI are triggering expensive repaints. It's often in places you'd never expect.
You can also enable the FPS meter to get a real-time frame rate overlay. If your animations are dropping below 60fps, you'll see it instantly.
This is the difference between thinking your page performs well and knowing it does.
5. Memory Profiling
Have you ever noticed your app getting slower the longer someone uses it, but had no idea where to even start looking?
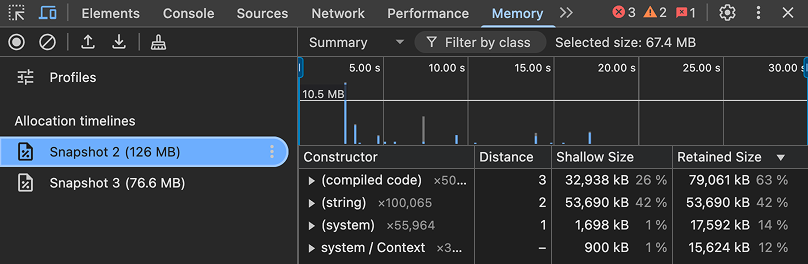
Open the Memory panel and take a heap snapshot.
A heap snapshot shows you everything currently allocated in memory (objects, arrays, closures, DOM nodes). You can take one snapshot, interact with your app, take another, and compare them. Whatever grew between the two is your leak.
The Allocation instrumentation on timeline mode is even more powerful. It records allocations in real time as you use the app, so you can pinpoint exactly which action is causing memory to grow.
AI-generated code is especially prone to memory issues. Forgotten event listeners, uncleaned intervals, retained references. The Memory panel is how you catch them.
AI made it easier to write code. It didn't make it easier to understand what your code is actually doing inside a browser.
DevTools is that understanding. It's not a last resort for when things break, it's how you stay in control of what you ship. The developers who stand out aren't the ones who prompt the best. They're the ones who can open a tab, look under the hood, and actually know what's going on.
You now have five reasons to start.